


States in the Great Lakes and central Midwest regions are among those that have the highest prevalence of COVID-19 infections in the most recent recorded week, maps produced by the Centers for Disease Control and Prevention (CDC) show.
Two of the federal agency’s administrative regions had, on average, a prevalence of antigen tests returning positive results above 15 percent of those taken in the week ending December 30.
The upper East Coast and Pacific Northwest saw elevated positive tests, while the rest of the country saw comparatively low test positivity rates, figures released on Sunday show.
The recent uptick in positive cases and hospitalizations with COVID is something health officials have been expecting during the winter months. Colder weather tends to lead to an increased spread of viruses and other infections as immunity is lower.
The CDC reported that, nationwide, the prevalence was around 12.3 percent of tests undertaken—a 0.1 percent decrease from the previous recorded week. The geographic picture of where positive cases are occurring shows test positivity dropping off for many regions following the holiday period, while a higher number of cases persists for the central Midwest.
CDC
Elevated infections of respiratory diseases such as COVID and influenza have led to some hospitals in California, Illinois, Massachusetts, New York and Washington D.C. bringing in fresh mask mandates.
The CDC does not give test positivity percentages for individual states anymore, instead giving them as an average across its administrative regions. Region Seven—which includes Iowa, Missouri, Kansas and Nebraska—had an overall prevalence of 17.8 percent positive tests out of 6,989 taken, down a marginal 0.6 percent on the prior week.
Region Five—Illinois, Indiana, Michigan, Minnesota, Ohio and Wisconsin— had a test positivity rate of 15.1 percent out of nearly 20,380 taken, an increase of 0.2 percent on the previous week.
Four regions comprising New England, the Mid Atlantic and Pacific Northwest states had rates of positive tests between 10 and 14.9 percent, as well as Washington D.C. and Puerto Rico.
All other administrative regions had test positivity rates between five and 9.9 percent. Region Nine, which includes California, Nevada and Arizona, had the lowest rate, 8 percent, a decline of 2.5 percent compared to the week ending December 23.
The CDC said that the data did not include tests taken at home and added that the results may be subject to change due to delays in testing centers reporting back.
“The data represent laboratory tests performed, not individual people,” the CDC said, as one person may be administered multiple tests in a week. The agency added that the percentage of positive tests “is one of the metrics used to monitor COVID-19 transmission over time and by area.”
Meanwhile, across the U.S., hospitalizations with COVID continued to increase, with some of the highest rises seen among states on the East Coast. The only state to see a decline in hospital admissions was Nebraska.
Health officials expected an uptick in infections as people traveled and mixed for the holidays. Increases in hospitalizations are typically offset from increases in positive cases as there is usually a delay between infection and symptoms requiring medical treatment.
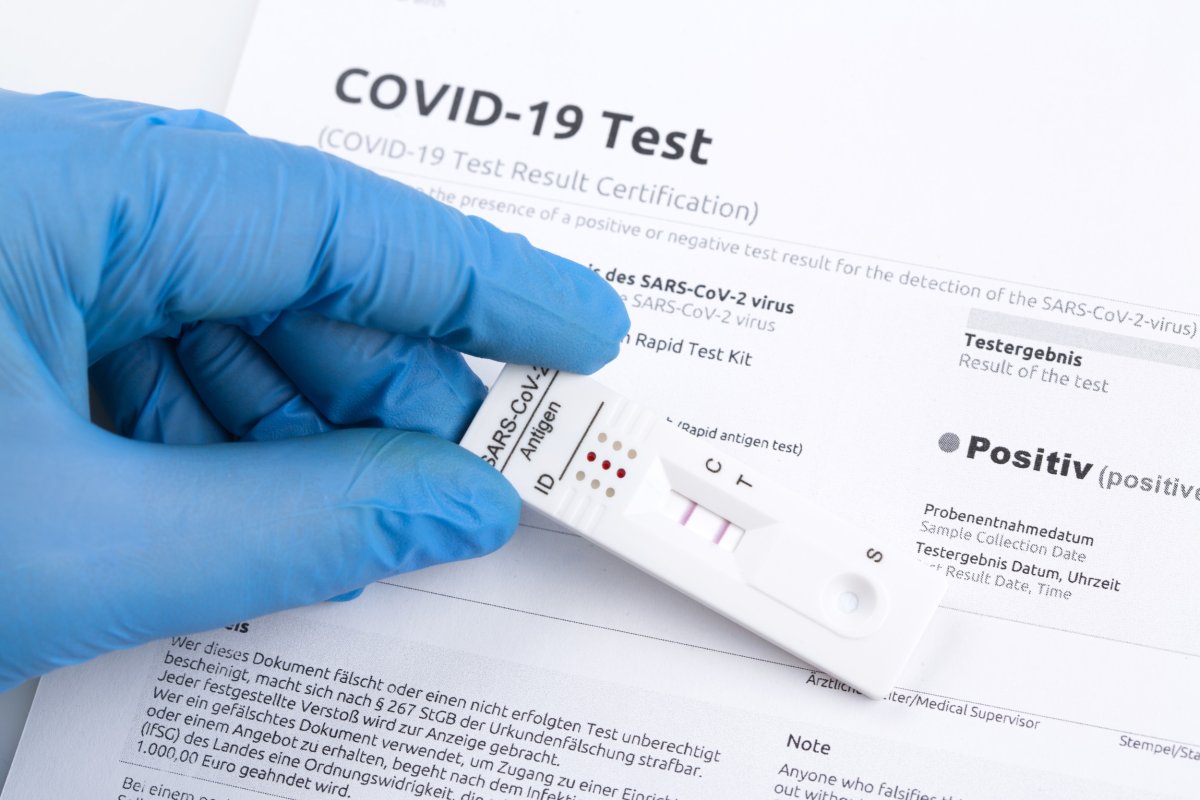
Panorama Images/Getty
Uncommon Knowledge
Newsweek is committed to challenging conventional wisdom and finding connections in the search for common ground.
Newsweek is committed to challenging conventional wisdom and finding connections in the search for common ground.