


States in the Great Lakes and northern Midwest regions are among those that have the highest prevalence of COVID-19 infections recorded in the most-recent week, maps produced by the Centers for Disease Control and Prevention (CDC) show.
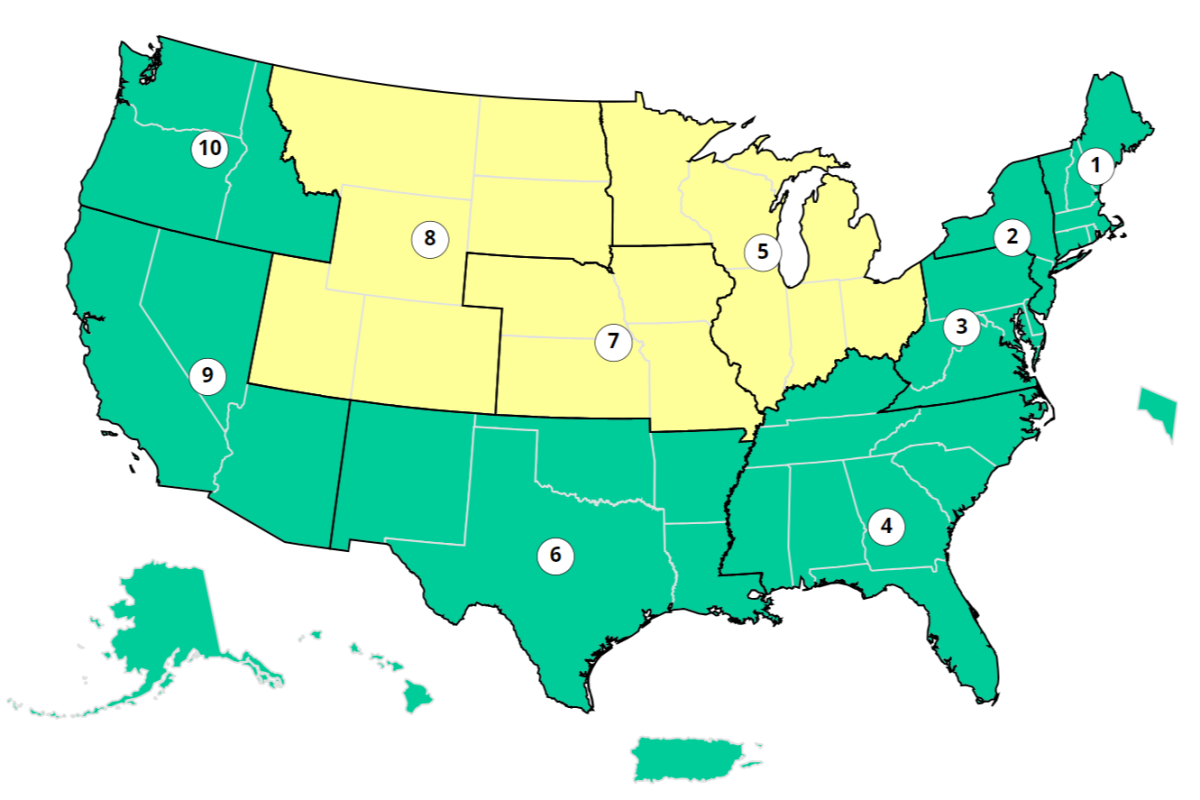
The federal agency’s northern central administrative regions had on average a prevalence of antigen tests returning positive results above 10 percent of those taken in the week to November 11. The rest of the country saw comparatively low test positivity rates, figures released on Friday show.
Nam Y. Huh/AP Photo
The CDC reported that. nationwide, the prevalence was around 8.4 percent of tests undertaken—a 0.1 percent increase from the previous recorded week. The geographic picture of where positive cases are occurring has remained largely the same in the last two weeks, though the total number of positive tests appears to have fallen slightly in the last month.
Positive cases and hospitalizations with the virus had been steadily rising over the summer, but appeared to peak at the end of September before plateauing. However, a CDC spokesperson previously said cases could pick up over the winter.
Localized rises in cases through the summer prompted some private institutions, hospital operators, and colleges in the U.S. to reintroduce the requirements for staff or visitors to wear masks while at their sites. Many of the institutions have since relaxed their mask mandates, though some hospitals in New Jersey later brought them back.
CDC
The CDC does not give test positivity percentages for individual states anymore, instead giving them as an average across its administrative regions.
Region Five—which includes Ohio, Indiana, Illinois, Michigan, Wisconsin and Minnesota—there was a prevalence of positive tests of 10.4 percent out of nearly 13,000 taken that week, a change of 0.6 percent on the week prior.
Region Seven, comprised of Iowa, Missouri, Kansas and Nebraska, had a test positivity rate of 13.4 percent out of around 5,300 taken, a rise of 3.4 percent on the previous week.
Meanwhile, Region Eight—made up by the Dakotas, Montana, Wyoming, Utah and Colorado—had an overall prevalence of 12.4 percent positive tests, out of nearly 2,500 taken, up 0.7 percent on the prior week.
All other administrative regions, including both the East and West Coast, Southern states, Alaska and Hawaii, as well as Washington D.C., had test positivity rates of between 5 and 9.9 percent.
The CDC said that the data did not include tests taken at home, and added that the results may be subject to change due to delays in testing centers reporting back.
The CDC also said that “the data represent laboratory tests performed, not individual people,” as one person may be administered multiple tests in a week. However, the CDC added that the percentage of positive tests “is one of the metrics used to monitor COVID-19 transmission over time and by area.”
At the same time, state-by-state increases in hospitalizations appear as more of a patchwork in the most-recent week recorded, though Great Lakes and northern Midwest states are among those to have seen moderate to substantial rises in hospital admissions with the virus.
Nationally, in the week to November 11, there were 16,239 hospitalizations with the virus across the U.S.—an overall rise of 8.6 percent on the previous seven days.
Uncommon Knowledge
Newsweek is committed to challenging conventional wisdom and finding connections in the search for common ground.
Newsweek is committed to challenging conventional wisdom and finding connections in the search for common ground.